SECTION ONE – Introduction
Background to the Report.
For many years, the writer of this paper has felt that more attention should be paid to the Presentation of Cave Survey data. As a result, a paper on this subject was -written in December 1 964, and shown to a few cavers. Their comments being favourable on the whole, the writer then prepared a brief paper called ‘A new approach to Cave Surveys’ which he circulated privately amongst about 30 cavers from a number of clubs and invited their comments.
These comments were very interesting. Nearly all those contacted thought that the work should be published as a B.E,C. caving report, but their individual reactions varied from very much against to very much in favour. Two such comments are reproduced below to illustrate these extremes:-
Comment 1.
“The general effect of this effort will be a regrettable increase in the amount of paper produced by armchair experts who forget that a lot of fun is gained when exploring caves and overcoming the unexpected.”
Comment 2.
“Until reading the note I hadn’t realised how specialized present surveys are. I have no intention of using again the present formal system which I believe to be inadequate and confusing even for Engineers.”
Equally of interest were some of the comments which, unfortunately, showed that some readers had jumped to wrong conclusions. This was, no doubt, the fault of the brief paper although it had been hoped that the use of an eye catching layout would have driven home the points. To correct any of these conclusions at this stage, some comments are attached below:-
-
- This paper is NOT concerned merely with advocating the use of present¬ation methods like the Severity Route Diagram or forms of isometric presentation. Some readers seemed to think that they were being asked to abandon more conventional forms of survey altogether. The message is “There is a place for everything – including the conventional survey’. The fact that very little is said about the conventional survey is merely because it is assumed that the reader is familiar with it and does not want to be told what he already knows.
- This paper does NOT advocate ‘clutter’. It warns against the dangers of introducing information in forms difficult to understand. In some cases, it advocates surveys which are almost free from any information other than that of the cave outline. In others, it suggests that the maximum possible amount of information is given consistent with clarity.
- On the other hand, this paper DOES suggest that the present methods of presentation are limited and should be used with discretion, in particular it suggests that the present C.R.G. system of grading and presentation should not be regarded as the only worthwhile method of presenting survey results. Frankly, it would like to see it die a natural death. This should not be regarded as a revolutionary suggestion but be seen as a natural culmination of trends which have been gathering momentum over the last few years.
- Finally, this paper DOES NOT attempt to replace existing systems with a system worked out in great detail. Every science demands a discipline from its practitioners and a state of complete anarchy will do no good. On the other hand, it can be equally bad to settle into a rut. What is being suggested is a framework within which a number of types of survey will have their place.
Since the original paper was written in December 1964, the problem of presenting portions of St. Cuthbert’s Swallet have already begun to lead the surveyors, concerned into experiments with novel presentation systems. In this cave system it is likely that the complexity will eventually demand new methods of approach and the author hopes that this paper may have some degree of relevance towards the solution of this and other problems.
The Instrument Engineer’s Approach.
Cavers, and cave surveyors, are drawn from a wide variety of backgrounds and professions. That of the writer happens to be Instrument Engineering and, as a result, it appears natural to him to look at the subject of cave surveying in terms with which he is familiar and experienced.
As in all problems involving the taking of measurements by means of scientific instruments, Cave Surveying may be regarded as an exercise in measurement. Such exercises normally fall into three parts. The first of these – Data Acquisition – concerns the employment of the measuring instruments involved with particular emphasis on the errors associated with the conditions under which the instrument is actually used. The second part – Data Processing – involves the handling of the data as obtained from the instruments and includes such steps as the application of corrections. The final phase – Data Presentation – concerns the use of this processed data to produce the final result in the form required by the user.
The problem is ideally tackled by first obtaining from the user of the information a clear picture of what he wants and expects to receive. Sometimes his wants are beyond the scope of known measuring instruments under the circumstances in which he wants to use them and he must the be told that his wants cannot be met. However, assuming that they can be, the most suitable instruments are then chosen and a method of arranging the results to comply with the form in which they are to be finally presented is then worked out.
The task of realistic definition by the user applies with particular force to the determination of the accuracy required. Accuracy, in all fields of measurement, is only increased beyond a certain point at the cost of greatly increased time spent and expense of the equipment involved. Time spent in search of one aspect of the requirement beyond the real need of the user is not only wasted, but often results in time not being spent on other aspects.
This then, is the approach to be adopted. T he next step is to see how far these remarks apply to the subject of Cave Surveying.
Applications to Cave Surveying.
Since the days of William White (i), the earliest cave surveyor known to the writer, the object of the cave surveyor has been to produce the best possible survey consistent with the tools, time and skills at his disposal.
To this end, considerable thought has been given to the choice of suitable measuring instruments and to their techniques of use and of mutual consistency. Since the war, many workers have contributed to this aspect of cave survey practice, particular examples being the work of Butcher (ii) and, more recently, that of Ellis (iii) and Warburton (iv). It can be reasonably claimed that the subject of data acquisition as applied to cave surveying has not been neglected.
Data processing in this context consists of applying suitable corrections to the data produced; checking the accuracy and consistency of such data and handling it in a manner that does not of itself introduce further errors. A good example of this type of data processing, carried out in a scientific manner, may be found in Crickmay and Bendall’s paper (v) on the survey of G.B. Cave. We may again conclude that this aspect of cave survey work has received sufficient attention, especially when we remember that much of the general literature on the handling of survey data is applicable to cave surveying.
Although it would be idle to suggest that no work has been done in the field of data presentation, the writer feels that this is an aspect of the practice of cave surveying which has been relatively neglected compared with the former subjects. As an example here, it may be of interest to examine the findings of the Mendip Cave Survey Colloquium (vi). Under the heading of “Presentation” were discussed scales; gridding; symbols, and sizes of sheet. In no case were departures from present practice of more than a marginal nature discussed. The colloquium was attended by most of the Mendip cave surveyors and it would be reasonable to assume that the subject of presentation was one in which little further progress was felt to be either desirable or necessary.
This, in the writer’s opinion, may well be because the problem of producing a cave survey, regarded from the point of view mf the instrument engineer, has traditionally been approached from the wrong end. The surveyor, having decided to produce a survey, asks himself “How accurate, and possibly detailed, can I make this survey, given the instruments and time at my disposal and the working conditions existing?” In case it is felt that the writer is manufacturing a case, the reader should make enquiries amongst owners of cave surveys and determine for himself how much real use is, in fact, made of surveys carried out on this general principle. It is suggested that the correct way of approaching the problem of producing a cave survey is for the potential surveyor to ask himself, “Who will want to use this survey, what for, and under what circumstances and how can I produce this data in the form which will best satisfy these requirements?”
If the two questions produce the same survey, it can only be because either there is only one possible way to produce a survey, or because all cave survey users are cave surveyors.’
Assuming that these statements are not true, then the approach should be: –
(1) To attempt a realistic working definition of user requirements.
(2) To decide from these what data is required.
(3) To explore the best methods of producing this data.
Objects of the Paper.
The objects of this paper are therefore to follow this line of reasoning with the assumption that the bulk of the study required will be in the least studied field of Data Presentation. Later in this paper, methods of presentation in which the writer has made some crude initial progress will be described.
It must not, however, be supposed that the writer is attempting to ‘lay down the law’ on cave survey presentation. The attempts shown later are no more than the first tentative attempts at breaking new ground. It is probable that a considerable amount of time must elapse before any new method of cave survey presentation can be said to have evolved sufficiently for standardisation to be considered. In fact, the introduction of sets of standards into any field of enquiry must always remain a two edged weapon. On the one hand, a welcome degree of consistency is obtained and the user – once having learned the language – is enabled to read any number of similar presentations with a minimum of effort, misunderstanding or confusion.
Against this, the acceptance of a standard tends to stifle originality by equating in people’s minds the labels ‘Non-standard’ and ‘Sub-standard’. By this token, some potentially good original work will always tend to be lost, since nearly all workers will tend to use the accepted standards rather than risk the non acceptance of their work because of a departure from accepted practice.
The ideal state of affairs is almost certainly to have a set of standards, but to introduce them at the right ‘state of the Art’. Too early an introduction will produce the loss of original thought already mentioned while too late an introduction may bring the entire subject into disrepute through untidiness. Unfortunately, the timing of an introduction of standards remains largely a matter of chance and the writer ventures to suggest that, as far as cave survey presentation is concerned, it has probably occurred at too early a stage.
It is thus in an attempt to stimulate fresh and original thinking on the subject of presentation that this paper has been written. Its author will naturally feel pleased if any of his ideas find a measure of approval or form eventually a basis for some more advanced presentation system. If, on the other hand, the paper does no more than to create a feeling that finality has not yet been reached in cave survey presentation methods, its object will have been largely achieved.
SECTION TWO – The Uses of Cave Surveys
User Requirements.
The first step which must be taken is to attempt to produce a specification of” user requirements and this must be carried out before any further deductions can be made. It is not, however, easy to find good working definitions. The opening paragraph of the chapter on Cave Surveying in ‘British Caving’ (vii) is probably as good a starting point as any. It reads:-
“A survey drawing can be of interest and use to every type of caver, whether he is a casual sightseer or a scientific worker. It gives him a preview of the underground system; it enables him to plan his visit and calculate the ropes and ladders necessary and a route map saves waste of time in a complicated cave-system.
Most research work connected with caves requires a survey of some sort, but the standard of accuracy required for investigating the geology of a cave system is greater than a mere route map demands. Archaeologists, Biologists, Hydrologists and many others work in caves, and. all need a survey on which to plot their findings.”
The point implied here seems to be that cavers need a survey as a route map; a means of obtaining a mental preview of the cave system, and as a basis on which to estimate tackle. Cave research workers need a survey in connection with their work. This latter use requires a rather more accurate survey than does the former. Let us now examine some user requirements in more detail to see whether this viewpoint can be substantiated.
Exploration.
Although exploration is not mentioned in the above quotation as one of the uses to which cave surveys may be put, it is only omitted because the reference book in question has already devoted an earlier chapter (viii) to the subject.
Explorers use a survey to note likely places for further investigation and to decide whether their attempts at further penetration of the system are likely to lead to success. They may thus use a survey in one of two ways:-
-
-
- As a notebook on which they may record future plans and decisions made in the cave, or…
- As a means of making such plans and decisions where possibilities as revealed, by the survey itself.
-
It would therefore seem that the needs of explorers will probably be largely met by any reasonable survey – preferably drawn to a fairly large scale to enable detail to be sketched in around places of interest and to allow ample room for the making of notes applicable to the portions of the cave system under close investigation. A really high degree of accuracy is highly desirable but not essential, since most decisions to force likely connections or new ground will be taken by on the site inspection, using the survey as a general guide as to probable direction of the new passage.
Archaeology.
The archaeologist requires a cave survey to act as a reference framework on which to plot his findings. In addition, he is often more specially interested in the entrance zone of a cave, and here he may even require a special microsurvey of a very small portion of the cave to a very large scale for the accurate relative placing of finds. This would constitute a specialist requirement not shared by other workers except possibly those interested in improving entrance facilities and occasionally by biologists. Apart from this specialised need, any reasonable survey would satisfy his general requirements.
Geology and Hydrology
As suggested in the paragraph on requirements already quoted, the geologist and the hydrologist are concerned with problems of passage alignment and. relative level, with relation to the dip and strike, and with a variety of similar requirements all of which demand the highest possible degree of accuracy. In addition to this, the geologist and the hydrologist require sufficient date, on the probable degree of accuracy actually obtained to be able to estimate their chances of error in conclusions they may draw on cave alignment and water flow when correlating their observations and measurements with the data as given be the survey. If this is accepted, then we already see that different types of user require different degrees of accuracy.
Biology.
It is suggested that the biospelaeologist (or spelaeobiologist if preferred) will be catered for by the requirements of the archaeologist already discussed.
Photography.
The photographer who wishes to record viewpoints taken and to note future work will, it is felt, be satisfied, with surveys in line with those discussed in connection with exploration.
Caving.
The word spelaeologist has been quite deliberately omitted from the title of this section, as the type of user to be considered here is the ordinary general caver rather than the scientific underground worker and it is thus the intention to contrast (if and where applicable) the requirements of the general caver with those of the various specialists previously referred to. Referring once more to the user requirements noted earlier, we remember that three uses were suggested by ‘British Caving’ as being in line with the requirements of the general caver. These were:-
-
-
- To obtain a mental preview of the cave system.
- To plan a visit and to calculate the tackle required.
- To plan a route through a complicated cave system.
-
A mental preview is not an easy thing to define. Ideally, a grade 1 sketch will provide this, providing that the artist(?) has that happy knack of suggesting the type of cave in his drawing. The late Don Coase possessed this flair to a marked degree. The writer was present on one occasion when Coase drew an elevation of the arête pitch in St. Cuthbert’s. The entrance rift at the time was still only 7″ wide and the writer as a result had not yet been able to visit the cave. The degree of ‘mental preview’ afforded by Coase’s sketch was extremely great: so much so that, on seeing the actual scene later, the writer had a distinct feeling of having seen the place before. Such a degree of pictorial representation is not, however, possessed by the average surveyor and, whilst no surveyor or caver possessing this gift should fail to use it to its utmost, any practical system of presentation must assume an average of this type of aptitude on the part of the surveyor and no more. However, the mental preview is a useful requirement and this aspect of the use of a survey should not, as a result, be overlooked.
In order to plan a visit properly, much more than a knowledge of the tackle required is wanted. Caves may demand anything from ordinary ‘Mendip’ clothing plus a helmet and lamp to a full set of gear for coping with sumps – and preparations for the trip may range from almost none to the organising of food, changes of clothing, provision of waterproof containers etc. The ability to satisfy the need for sorting out all the gear required by means of a survey will require much thought.
Again, planning a route through a complex system will require much more then just an indication of the possible routes. Some passages may not be passable to all the party, or not under all weather conditions, again, much thought will be required if this use of a survey is to be reasonably catered for in the presentation.
Having discussed briefly some of the problems which will arise from attempting to meet the requirements as laid down in ‘British Caving’ it remains to be seen whether there are any further requirements likely to be of interest to the general caver. In this connection it may be of interest to quote from the findings of the Mendip Survey Colloquium as follows:-
“The purpose of a cave survey is to portray the form of a cave and the nature of the cave passage, together with details of general (non-specialist) interest. The general caver does not want his survey covered with specialist information.”
These remarks seem to the writer to be very true, with the possible exception to the emphasis placed on the need for accuracy. The general caver, who, after all comprises the great majority of potential cave survey users, does not want specialist information. We should, at this stage, have a fairly clear picture of what he does want. He wants his survey to tell him as much as possible about caving in the cave. His questions will therefore be of the form ‘What sort of cave is it? What and where are the main obstacles? What tackle will be required and what is provided permanently? What and where are the sights particularly worth seeing; noting or photographing? How long can any given trip along a particular route be expected to take, given a party of average cavers under average conditions? What portions of the cave arc liable to flooding and are these liable to cut the party off from the entrance? What passages, on the other hand, are only negotiable in times of drought? How wet is the party likely to get? How muddy? (This might be of importance when contemplating, say, photography). What places have heavy drip which could put out a carbide lamp? Are there any places involving long delays or unusual caving techniques? Are some passages only negotiable to cavers of smaller than average physique? Are there any places where particular attention should be paid to hazards such as unstable rock, poor ventilation etc? T he answers to any of these questions are rarely found on any sort of survey.
That, one may justifiably ask, is the real use of a survey drawn from a highly accurate centre line to a reasonably large scale to the general caver when it contains – apart from a bare outline and some symbolised chamber and passage detail items such as the position of permanent survey stations; spot heights above O.D, and similar information, but contains none of the answers to questions such as those posed above?
Summary on User Requirements.
-
- Although there are several main types of user, their broad requirements may be divided into two classes.
- The Specialist Caver, requires an accurate framework on which to annotate his specialist information and for general referenceAs a result of his use of a survey, he will convert it into a specialised survey of interest and information to all classes of caver; whether they be fellow specialists in his own field, in other fields, or general cavers. He is numerically in the minority but his work is important in furthering underground knowledge and justifies the work spent on preparing for him an accurate survey to the greatest possible degree of precision. He is normally a skilled and experienced caver who probably does not want any general caving information. If he does, he would probably prefer to obtain this from a separate survey, leaving his type of survey relatively uncluttered so as to act as an accurate blank (or nearly blank; form on which to compile his information. Indeed, the Mendip Cave Survey Colloquium is quite definite on this point and concludes that ‘the specialist does not want specialist information recorded on the survey for him by a non-specialist surveyor! The specialist will, or should, disregard such information as being unreliable. Since he is also, as we have already noted, unlikely to want general information either, the ‘accurate blank form’ concept results.
- The General Caver, requires a survey which tells him as much as possible about theHe does not necessarily require a high degree of accuracy although, if this is available, so much the better. Ideally, he should be able to visit a strange cave and, from the survey, know what sort of party to take; what tackle; what clothing; how long to allow for the trip; what lighting; whether food will be necessary; if it is worth taking a camera and a whole lot of similar information. He therefore requires a survey telling him a great deal in a form readily understood and assimilated.
Having found our user requirements, we note that the present method of presenting a cave survey fulfils neither of these requirements ideally. We must remember that the one class of caver for whom a survey is not specifically aimed is the cave surveyor, and that any survey should thus be directed towards some class of user and not produced as an end in itself. We can, in fact, go further and note that the present type of cave survey presentation is more aimed at the specialist user than at the general caver, who forms the least catered for class in spite of his great numerical superiority. Work must therefore be directed towards extending the scope of cave survey presentation to include this wider public. Such work is more urgently required than that which goes into perfecting what is already good practice on the present type of cave survey.
The remainder of this paper shows some ways in which the necessary steps can be taken, and starts by suggesting some presentation techniques which may be of use in compiling surveys aimed, at specific groups of users which will fulfil the requirements of that type of user.
SECTION THREE – Presentation Techniques
Before we can go on to actual surveys, we must examine some of the techniques which can be used. Caves (like cavers) vary enormously end even when presenting the same type of survey (for example, one intended for use by the general caver) it may be necessary to vary the presentation technique to suit the size, structure and complexity of the cave system.
The aim, therefore, of this section is to examine some of the possible techniques since, in order to work effectively, the surveyor should have as wide a variety of tools at his disposal. Some of the techniques may have a varying range of application but should not be disregarded on this account as the ‘off beat’ approach may at times be more suitable than more conventional methods.
Topography and Topology.
For the purpose of this paper, a topographical presentation may be defined as one which attempts to portray the size and shape of the cave by suitable geometric drawing. Topology, on the other hand, is concerned with the properties of geometrical figures if we imagine them to be drawn on a surface which can be stretched or deformed out of the original shape. It is sometimes known as ‘rubber geometry’. Under these circumstances, an ellipse is the same figure as a circle. Properties of figures which remain constant under topological conditions are called invariants and one such is the sequence of points along a line. Thus, a topological route map would not allow distances or directions to be measured from it, but will always give sequence correctly – an example being the London Tube maps.
The advantage of such diagrams lies in the improvement in clarity. Examples of topological techniques will be found later in this report.
The Plan, Elevation and Sections.
The usual form of topographical presentation involves the use of some form of plan, elevations and sections, and is sufficiently well known and understood to warrant little further comment. Some variety in detail is possible however and a few examples follow:-
Elevations.
Whereas, for instance, the plan always consists of the projection of the cave system onto a horizontal plane, an elevation can be taken as a projection onto any convenient vertical plane, and this can enable the surveyor to choose a plane for his principal elevation which will enable him to present the vertical structure of the cave to the best advantage or enable some prominent feature, such as a major rift development, to be presented with greatest clarity. In some cases, a number of subsidiary elevations may be considered to be useful.
Another elevation technique sometimes employed, known as developed elevation, consists of altering the plane of elevation to lie along the centre line of the passage, thus producing a “stretched out” elevation of the passage in question. The places it which the plants of elevation changeare normally shown as dotted vertical lines. This method of presentation, although giving a much clearer idea of total passage length, suffers from the disadvantage that where a passage branches and later joins up again, if one branch is relatively straight and the other has a number of bends, the shorter passage must be shown with a break in the elevation to enable joining up to take place.
Plans.
In the case of a cave plan which is determined by jointing, the major joint pattern may decide the most suitable ‘grid’ on which to present elevations. Indeed, in a cave of this type where the entire system lies between two parallel planes dipping at about 30° to the horizontal and about a hundred feet apart, a plan could be produced by projection onto one of these planes. This would have the effect of obviating the foreshortening of dip wise distances with respect to strike wise distances and would not only enable the (almost) true passage length to be read directly off the main, but, to a reasonable approximation the depth of any part of the cave could be read off as its down dip distance from the entrance shown on the ‘plan’. It is of course assumed that the plane of projection would be arranged so that it cut the surface at the cave entrance.
Sections.
Sections are usually included at points of particular interest or where confusion might otherwise be caused. Unfortunately, a degree of confusion cannot always be avoided even by the most careful choice of sections. Places occur where the limits of the cave are arbitrary -perhaps a rift or bedding plane with a caving route through it, but whose boundaries consist of gradually tightening cave space. Sections can go some way towards clearing this type of confusion by dotting the extremities, but the problem of limiting the amount of cave shown on the plan or elevation remains a problem.
Thus even with the well known system – dismissed at such short length in this paper because a high degree of familiarity is assumed -there are some cases in which a strictly topographical presentation has to give way to a conventional symbol or some form of more diagrammatic presentation. This leads us to consider the use of pure diagrams.
Simple Topological Diagrams.
As far as is known to the writer, the only topological treatment ever given to a cave system is that drawn of St. Cuthbert’s. This cave was depicted in this form by the writer of this paper (xi). This diagram was later modified by him and displayed for sometime at the Belfry and was later modified and used by Ellis (xii) and more recently by Irwin (xiii).
It will be noted that already a convention seems to be naturally evolving whereby circles are used to represent pitches. With this type of growth in mind, the writer has for sometime had the idea that perhaps an extension of this type of presentation could result in the drawing of a sort of ‘circuit diagram’ of a cave. The result of about a year’s work on this subject will be found in the next section.
The Severity Route Diagram.
‘No cramped constriction; water chill,
Nor dicey drop dismayed our Gil’
The above quotation from Spelaeode Six illustrates the three main types of severity to be encountered underground namely constriction, immersion and exposure and it is these three main types of severity which form the basis for the diagram.
The diagram is completely symbolic and topological and, as mentioned earlier, may be compared to an electronic circuit diagram. The latter uses only a few easily remembered symbols and is extensively used . Perhaps on these grounds, there may be hope for the future of the Severity Route Diagram.
The two basic elements of the diagram are the PASSAGE and the PITCH. The passage, which is not necessarily horizontal, but which does not involve climbing, is drawn as shown:-
![]()
…and denotes a clear passage with no particular restrictions to normal cave travel. The pitch is circular and is show thus:

… the blocked side is the UPPER passage, which will be evident if we consider the symbol as the plan view of this state of affairs: –

Thus we can draw our cave as a combination of passages and pitches. To this, we now add three more symbols, to represent constriction, wetness and exposure. With the addition of” these basic symbols, the diagram becomes complete. Admittedly, a number of different ways can now be found by which the symbols may be used in conjunction with each other, but this is no more than saying that with five letters of the alphabet, it is possible to make a number of words. The actual process of learning the basic symbols is not difficult. The symbols are as follows:-

At this stage, it should be possible for the reader to gain a reasonable amount of information from a severity route diagram without bothering to read further. However, it is possible to portray a variety of shades of meaning with the symbols described, and we go on to explore the possibilities further.
Passages
The symbol for constriction ![]() must be such that it is possible to use it without ambiguity in any way up or
must be such that it is possible to use it without ambiguity in any way up or
round, so that ![]() ,
, ![]() ,
, ![]() and
and ![]() all refer to the same thing. This being highly desirable, we must introduce a further slight addition to the basic symbol for constriction to distinguish between rifts and beds. We shall see later that this addition can be useful in other connections. The addition is as shown:-
all refer to the same thing. This being highly desirable, we must introduce a further slight addition to the basic symbol for constriction to distinguish between rifts and beds. We shall see later that this addition can be useful in other connections. The addition is as shown:-
| rift | bed |
without any further additions, we can now derive all of the following: –
| 1. | Passage with no obstacles. Normal cave travel possible. | |
| 2. | |
Rift passage sufficiently narrow as to prevent normal travel. |
| 3. | Tight rift passage. Wall touching average caver when travelling sideways. | |
| 4. | Bed. Average crawling necessary. | |
| 5. | Tight bed. Reasonably flat out crawling. | |
| 6. | Drainpipe. (A mixture of the signs for rift and bed indicating constriction in both directions as once. | |
| 7. | Narrow drainpipe. | |
| 8. | Localised squeeze. Rift type. | |
| 9. | Localised squeeze. Bed type. | |
| 10. | Localised squeeze. Hole type. | |
| 11. | Wriggle. Meandering rift. | |
| 12. | Wriggle. Meandering bed. | |
| 13. | Wriggle. Two dimensional. | |
| Very tight versions of the last three signs are denoted in the usual manner. | ||
| 14. | Heavy drip or falling water. | |
| 15. | Pool or stream. | |
| Note how the signs for rift and bed have been adapted. Vertical water is associated with the rift sign and horizontal water with the bed sign. | ||
| 16. | Travers. Exposed side shown. | |
| 17. | Bold step. | |
| 18. | Rift traverse by travelling above the floor. | |
The above signs show nearly all the possibly combinations of the passage signs. The signs, however, have been arranged so that they can be combined further if necessary, as an example, the sign…..
![]()
….would represent a passage consisting of a narrow rift with two localised rift squeezes containing also a pool or stream way on its floor. As an exercise, the reader might like to work out what the following means…..
![]()
Pitches
We saw earlier that the basic diagram for a pitch was a circle, broken at the downward end. Now we derive: –
| 19. |  |
Pitch. Drop in feet can be written alongside if required. |
| 20. |  |
Rift Pitch. A vertical descent down a rift, as in St. Cuthbert’s entrance. |
| 21. |  |
Chimney. A vertical drainpipe. |
| 22. |  |
Wet pitch. |
| 23. |  |
Climb. |
In addition tackle signs may be inserted inside the pitch symbol,
| |
For fixed ladder | |
For flexible ladder | |
For rope and | |
For chain or knobbly dog |
An example of the amount of information which can be presented by means of the severity route diagram symbols will now be given. This is supposed to represent a small part of a cave system and the description which follows the diagram can all be written directly from inspection of the diagram with no further knowledge of the cave concerned. The amount of space saved by the use of the Severity Route Diagram will thus be seen. It will later be shown that even more information may be conveyed by the use of this type of diagram with the addition of conventional signs, which can also be used with more usual types of cave survey.

Additional information (which is mentioned later in the text) includes how far the entrance (in time by the shortest route) when there is instability, where photograph scenery is to be found, how deep the water in the wet passage is, and when the floor is rocky.
(Reading from right to left.)
“……………… the passage continues with its wet floor, but affording no other obstructions until the first choice of route occurs. A fifteen foot chimney widens out into a twenty five foot pitch which is followed by a twenty foot climb. The pitch is laddered from the top of the chimney, a 40′ ladder being necessary. The chimney and pitch are wet, but it is possible to avoid the water during the final climb after the pitch has been descended.
This drop leads to a wide passage, with a stream or pools on its floor. After a while, a point is reached where heavy drip or falling water must be crossed and the passage continues – wet but unobstructed to the foot of the next pitch. This pitch is the lower end of the second route down. Instead of descending the chimney and pitch, it is possible to enter a fairly narrow rift at the head of the chimney until a traverse is reached. The ledge on which the traverse is made becomes very narrow and, to add to the difficulties, heavy drip or falling water is encountered at this point. It is possible to climb off the traverse end a 35′ climb lead to a bedding plane which becomes very tight and eventually leads to the head of the pitch previously mentioned in the lower wet passage. This pitch is fifteen feet deep and has a permanent fixed ladder provided.
If, on the other hand, the traverse is completed, it leads to a rift which widens slightly at first and then becomes an unobstructed passage leading to a thirty foot rift pitch down which it is possible to climb without tackle. The rift continues across the head of this pitch, but becomes too narrow and closes right down. Descending the thirty foot pitch, a narrow hole leads to the bedding plane and the fifteen foot pitch to the lower wet passage. The other route from the bottom of the
rift pitch leads, via a further rift traverse, into the wet passage a little further on. The wet passage now continues as a fairly narrow rift ”
We can see that the Severity Route Diagram forms a convenient shorthand, whereby much descriptive writing can be compressed into a relatively small space. In fact, by the use of conventional signs added to a diagram of this type, it is possible to obtain a complete description of the cave without any descriptive write up being necessary.
We must, however, remember that the Severity Route Diagram is neither a plan nor an elevation of the cave it describes. In the case just quoted, it appears to take the form of an elevation, but we must not be misled by this into thinking of this type of diagram in these terms, nor must we pay any attention to relative lengths of passage or to directions or changes of direction shown.
Variations on the Severity Route Diagram.
If, as the writer hopes, the Severity Route Diagram finds some measure of use as a method of describing the conditions to be found in a cave system, further signs will, no doubt, be added. Three such signs have already been suggested by those to whom a preview of this system has been given. These are as follows:-
| |
Sump. |
| |
Boulder strewn floor necessitating clambering over the boulders. |
 |
Large chamber through which a route or routes pass. |
These signs are compatible with the others since, in the case of a sump, the only other sign likely to be added to that indicating pools or streams is that for falling water or drip which will not occur in a sump. The boulder strewn floor symbol will not conflict with the symbols for constriction since, if a passage is both constricted and partially boulder filled, it will be shown as a wriggle.
In most, if not all cases, it should be possible to include a key to the symbols used on the diagram. This will prevent confusion and obviate the need for premature standardisation. Further examples of Severity Route Diagrams will be found at later stages of this paper.
Conventional Signs.
The use of conventional signs in connection with maps and surveys is a well established practice and probably dates back about as far as the first map, or certainly as soon as it came to ,be realised that a convenient and simply understood form of visual shorthand would save clogging a map up with too much written detail. The terms ‘Conventional Signs’ or ‘Symbols’ in the context of this paper is taken as including short words, since it is sometimes better to agree to use a word rather than a pure symbol. For example, if it should be agreed to be too difficult to produce a convincing and easily recognised pictorial representation of mud on a cave survey, it is probably better to write the word MUD where it occurs than to indulge in some arbitrary code of hatchings or shadings. Symbols which rely on memory association are very good, again provided that they are simple in form, easy to draw, and that the memory association is not unduly obscure. To quote an absurd example – a diagrammatic representation of Flanders and Swan to represent mud would not only be difficult to portray in a sufficiently simplified form, but its association would be far too tenuous and be merely an example of someone trying to be too clever.
We should therefore concentrate on simple, easily drawn symbols whose meaning is clear either from the start or at least from the first time it is explained. It is, of course, realised that a number of such symbols or conventional signs already exist, and it will be left to the reader to decide which of these fall in line with good symbolic practice. The more important study here is not so much to assess those signs which already exist as to determine what new signs are required to delineate
cave features not at present covered in this manner. If conventional signs become more widely used and more meaningful, any bad examples will fall by the wayside in the course of natural selection providing that we avoid the danger of premature standardisation.
In order to find what additional signs would be useful, it may be of interest to examine once more the list of questions we earlier postulated as examples of what a general caver might reasonably want to know from a survey about a cave. These are listed here as follows:-
-
-
- What sort of cave is it?
- What are the main obstacles?
- What tackle will be required?
- What tackle is provided permanently?
- What and where are here sights worth seeing or noting?
- How long can any given trip be reasonably expected to take?
- What portions of the cave are liable to flooding?
- What portions are liable to be cut off from the entrance?
- What passages are only negotiable in times of drought?
- How wet ere parts of the cave?
- How muddy?
- What places demand involved caving techniques or cause delays?
- What places demand abnormal physique?
- What places have unusual hazards?
-
Let us now take these fourteen points and see how far we can readily cover them by the use of conventional signs.
-
-
- This is, of course, a general question and will depend on the total use made of symbolism plus the general standard of theIt is not therefore possible to answer this specifically.
- Pitches are usually marked in feet on cave surveys and some idea of constriction can often be gained from descriptive names such as “Nutmeg Grater”, “Sausage Machine” and “Vice”Other obstacles come under question 14. Again, this is rather a general question which must be largely covered by the answers to later questions.
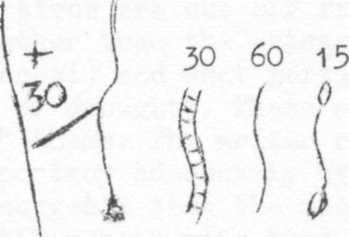
- Tackle required should be marked alongside places which require it wherever possible. There are a. number of ways of doing this and two are suggested here. Firstly, a very simple system would be merely to list the ladder, tether and rope lengths against the pitch. Thus we might have:-
-
 |
T 15
L 30 R 60 |
indicating that a 15′ tether, a 30′ ladder and a 60’ rope were necessary at the point shown (symbolism used for the actual pitch here is standard C.R.G. practice). Alternately, pictures can be used in the Severity Route Diagram, and we might have
-
-
- Permanent tackle, it is felt, should be symbolised using the signs of the Severity RouteWhere a rawlbolt or other form of permanent belay is provided, the letter ‘B’ could be used.
- A suggestion here is the use of the symbol
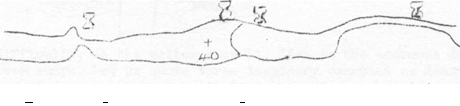
 to indicate places of scenic interest. Most people who have been shown this symbol have correctly identified it as a representation of a camera on a tripod, or have had no difficulty in agreeing to this it has been explained. It is suggested that this sign be used for places where spectacular formations, good underground views or interesting sights are to be found, in other words, those places where the average cave photographer is likely to want to stop and take a picture.
 - Information as to trip length can, it is felt, be easily shown by conventional signIt would, of course, have to represent the time taken by an average party under average conditions. The shape chosen for the symbol is that of an hour glass. Two systems are envisaged. In the simpler of these, which is perhaps more applicable to small caves, the symbols would be spaced at a constant time interval (say ten minutes) whilst in the more complete system they would appear at strategic points with the time in hours and minutes from the entrance. Examples of the two systems are given below: –
-
……for the simple system….

7, 8 & 9 All these questions are concerned with water under sump or similar conditions. The questions respectively are ‘What portions are liable to flooding? What portions are cut off from the entrance by flood (actually, it is the exit rather than the entrance one would be worried about under these circumstances!) and what portions are normally flooded but are negotiable in times of drought? These are all variations on the “When is a sump not a sump?” theme. The writer regards this as one of the most difficult subjects to portray adequately by means of conventional signs – so much so that he suggests that the reader try this for himself before reading further, whilst remembering that good symbols should be concise, easy to draw, readily identified and not able to be confused with any other symbols. Let us start with the symbols used at present by the C.R.G. to indicate sumps. These are: –
 |
For a sump in the streamway, or….
For a sump pool |
C.R.G. practice suggests annotation to indicate whether it is a duck or trap and the length of the submerged portion. Rather oddly, it makes no mention of the ‘state of the tide’.
Sumps have also been drawn as breaks in the cave plan as under: –
 |
Sump II |  |
……or with break lines as shown in the next example….


The difficulty, as the writer sees it, lies in the enormous differences between sumps. Let us quote three imaginary examples as descriptions and see if we can think of a single method of representing sumps which would allow all three to be fully described.
-
- This sump lies in a stream and remains ten feet long under all stream conditions, neverHowever, it ranges from easily free diveable under normal flow to completely impassable even by fully equipped divers under flood conditions owing to the extremely fast current and the complete absence of any holds.
- This sump is normally a duck in a streamUnder really dry conditions it is passable with reasonable airspace but under flood conditions it becomes a sump of unknown extent at its downstream end, since no caver is in a position to inspect it, by the survey it is presumed to be over sixty feet long under these conditions.
- This sump is an isolated pool which never changes its length in plan but, owing to the steepness of its elevation, becomes too deep to free dive under ‘high tide’ conditions.
The solutions suggested by the writer are only partial ones. The first consists of adding to the C.R.G. symbolism a high and low water mark as under:-
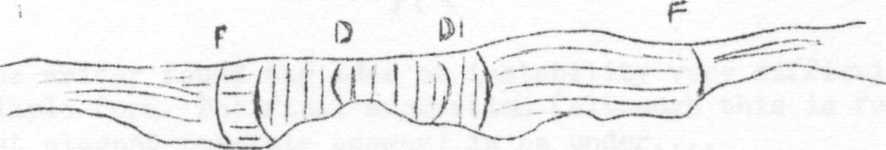
The normal outline indicating the normal length, and shape, the ‘F’ lines the boundaries of the sump under flood conditions, and the ‘D’ lines those under drought conditions. In cases where the sump ceases to exist under drought conditions, a single ‘D’ line in the middle of the sump would indicate this.
The second method is a purely symbolic solution and consists of the symbol as under….
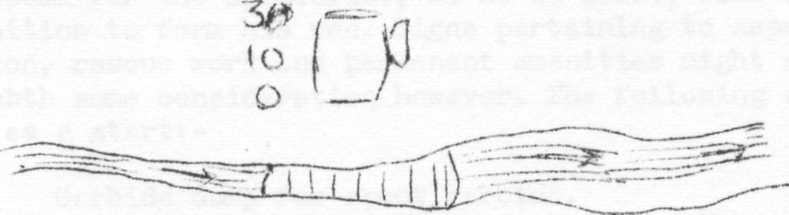
i.e. This sump is 30 feet long under flood conditions (when full) ten feet long under normal conditions, and non-existent under drought (empty) conditions.
-
-
- Wetness, as distinct from sumpiness, takes two main forms, falling water or water through which one has to wade orIn the case of heavy falling water, which is enough to seriously wet an otherwise dry caver, it is suggested that the sign as drawn below might be useful and certainly self explanatory….
-
If it desired to indicate how wet one becomes through wading or crawling in water, a series of stick men seem the only real answer as below:-

-
-
- Symbolism can, however, be carried tooIn particular, it is well to avoid signs which have no obvious connection with the feature being represented. It is therefore suggested that, where mud becomes a problem, the word MUD is written alongside the passage at intervals if necessary.
- The writer has no idea at all to offer here!
- Passages permitting only thin cavers to negotiate them (the most usual case of selection by physique) may be easily represented by the symbol…..
-

-
-
- The writer found the idea of instability very difficult to convey in a simpleThe final suggestion (although this is felt not to be the most elegant possible answer) is as under….
-

Having suggested some conventional signs which might form a convenient shorthand for some of the features of a cave system of interest to the general caver as an aid to the practice of caving, we should turn our attention to other conventional signs. It is not proposed to suggest any signs suitable for the specialist, as he no doubt, will be in a much better position to form his own. Signs pertaining to aspects of cave preservation, rescue work and permanent amenities might well form ‘a subject worth some consideration however. The following are therefore suggested as a start:-
| |
Carbide dump for spent carbide. | |
| |
Food dump. | |
| |
First aid box. | |
| |
Permanent phone line. | |
| |
Tapes marking boundaries of permitted caving to protect formations etc. | |
| |
Guide wire (as installed in sumps etc.) |
Isometric and Solid Techniques.
However good a survey presentation may be, a cave remains very much a three dimensional object and all two dimensional presentations will fail, to a greater or lesser extent, to capture the essential “feel” of a cave system. In general this is a fact which is recognised and we do not expect a survey to provide us with the kind of picture that a non caver would understand at first glance. Good surveys and/or diagrams can, after all, provide the caver with most if not all the information he actually requires and, just as we do not expect a map to say, show us the beauty of a particular view, so we recognise similar (if more pronounced) limitations to cave surveys.
This would tend to be the end of the subject were it not for the fact that people who have never been down a cave have literally no idea of what a cave is like or how a typical cave is constructed and thus have nothing on which, to build mentally when looking at a cave survey. In contrast to this state of affairs, anyone looking at a map for the first time has at least a familiarity with the subject being presented in this manner. We are therefore suggesting here that the main use of isometric and solid techniques, lies in the presentation of caves to non cavers.

Turning first to Isometric techniques, these may be divided into two basic types which the writer has called the Isometric Section and the Isometric Diagram respectively. The Isometric Section imagines the ground to be cut away in suitable slices so that the major features of the cave system are half uncovered. Even if working from an accurate and detailed survey, the making of such a section calls for a very high degree of artistic ability indeed of the kind possessed by commercial illustrators who draw out away versions of machinery entirely from engineering drawings, often before an actual example of the piece of machinery is in existence. No such example of a cave drawn in this manner is included in this paper, the writer not possessing this ability.
It is to enable isometric techniques to be used without the need to be an artist that the writer has evolved the Isometric Diagram. This is prepared from a survey of conventional form by ‘squaring off all passages, chambers etc. and imagining them to be composed of, and to run in straight lines. These can then be drawn to scale onto isometric paper. The previous page shows such a diagram of a portion of G.B. cave drawn on these lines. It is possible to extend this idea slightly within the scope of the average cave surveyor and the next page shows a portion of St. Cuthbert’s Swallet using a slightly different technique in which the main route has been diagrammatically sectioned, leaving the other passages as apparently solid shapes. It is felt that this technique may go some way towards enabling a reasonable three dimensional picture of a cave to be built up without requiring abilities which are too scarce to warrant their general use.
Isometric paper does however suffer from the disadvantage that no tapering away to a point at infinity is included. No doubt a grid which did this could be constructed using the methods of projective geometry and, although this might take a long time to prepare, it could, once produced, be copied and used as a master for this type of work.
Solid models fall again into two categories. The “inside out” model – in which the cave airspace is represented by a solid shape and the surrounding rock by air (as though one had filled the entire cave up with solid and then dissolved away the surrounding rock) has the advantage of being reasonably easy to make, but the great disadvantage of not being readily identifiable as a cave. A model of this type was made by the writer and exhibited at the “Our Way of Life” exhibition held in Bristol in 1951 as part of the Festival of Britain. The subject was G.B. cave, and the data for the model was taken from the Crickmay and Bendall survey. It was found that non cavers were completely at a loss to understand what the model was supposed to represent, and even some cavers found it difficult. On the other hand, those who could form a picture from the model found that it showed jap the structure of the cave at a glance in a way that no two dimensional map ever could.
The other form of solid model is, in fact, the solid version of the Isometric Section. Anumber of specimens of this type of cave presentation are known to exist. The work involved in the preparation of such a model is, however, veryconsiderable and beyond the scope of this paper to discuss in detail.
The Use of Colour.
The reason for including the use of colour at this particular stage of the review of presentation techniques is that it is not generally practical to produce coloured surveys for widespread distribution, as the cost of any colour printing process tends to be prohibitive by caving standards. Because of this, coloured diagrams, like solid models, fall more into the heading of special techniques.
Simple coloured additions have already been used on published survey work. In cases known to the writer, these have been added to the printed copy by hand. One such example is the survey of Eastwater Cave by Warburton, in which the stream was coloured. The practice of hand colouring printed surveys in order to emphasise certain features is probably more widespread than the writer’s limited experience suggests. One obvious use for such copies of surveys is to colour those which are displayed in Club Headquarters or Club Libraries.
Having suggested a limited area of use for coloured surveys, some attempt must now be made to classify methods of using colour.
1. Feature Colouring.
Cave features may be rendered clearer by the use of colour as already suggested. Obvious choices are blue for water, brown for mud, yellow perhaps for sand or gravel deposits etc.
2. Series Colouring.
Complex cave systems often involve the superimposition of some parts of the cave over others, on the usual plan and elevation techniques. Some degree of clarification can sometimes be achieved by colouring the various series of the cave system in different colours. Filling in the cave space by colour washes is not a good idea, as confusion will often result when two or more colours are overlaid. Since the survey will be already printed in black and white, the methods to be adopted are either to draw coloured lines, dots, hatchures etc outside the existing black lines, or to arrange to print the survey very lightly so that the lines can be drawn over in colour.

3. Layer Colouring.
To the writer’s knowledge, this has only been done once, and he has in his possession a colour contoured plan of G.B. cave in which layer contouring of the floor heights has been carried out at ten foot intervals. The result of this very considerable amount of work was not felt to be justified, as a surprisingly small increase in the clarity of presentation results. Nearly fifty tints made by mixing Pelican inks were used.
4. Specialist Colouring.
This would seem to the writer to be the most important use of colour in cave survey presentation. In a later stage of this report, the problems confronting the publisher of a final survey are discussed. One of these is how to include all the information obtained by various specialists. The inclusion of all data obtained on one survey copy may well make that document impossible to read with any clarity. On the other hand, it may well be decided that the publication of a number of separate overprints of the final survey would be unwieldy. One answer to this type of problem may well be to mark all information relating to (say; geology in red; hydrology perhaps in blue; biology in green etc. Providing the amount of this sort of information was not too great, it might be practical to do the actual colouring by hand on the final copies.
With this reminder of the basic difficulties inherent in the use of colour as applied to a number of copies, it is felt that the use of colour has been discussed as far as is warranted in a paper of this type.
Embellishments.
Although a survey is primarily a scientific record of the work carried out by the surveyor and other specialists, to some extent it may also be regarded as a work of art. While it is not being suggested that the surveyor take a lot of time drawing little cupids blowing winds in the style of old maps of the world (or perhaps little devils stoking fires), there is no reason why he should not add the odd individual touch if he so desires. One traditional place where such self expression is traditionally permitted is in the drawing of a North Point. The restrained use of the odd embellishment does not necessarily reduce the survey to the level of a comic cartoon. It may well be a way of making the surveyor’s point that he has spent a lot of time on the careful laying out and drawing of the survey
This mention of embellishments brings this section on techniques to a close. It is unlikely that all possible techniques have been covered, and of those dealt with, the subject has not been treated exhaustively. The main point that the writer wishes to put over here is that the surveyor – having made up his mind by conscious thought as to what class of audience he is directing his survey – should use any technique which seems to him best fitted to achieve his object.
The next section of this paper suggests what such objects might well be.
SECTION FOUR – A System of Cave Survey Presentation
Introduction.
We should, by this stage, have some reasonable idea of what is wanted byway of survey information. We have also explored, in the last section, some of the techniques by which this information can be presented. What now remains to be done is to tie our knowledge of what is wanted and how it can be produced into a system. We have already said that such a system must not1 be too inflexible – and condemned the present C.R.G. system for just this reason. On the other hand, we must introduce some degree of method into whatever system we advocate on the lines of this paper. Such a compromise has been reached by the author, and will be described in this section of the paper.
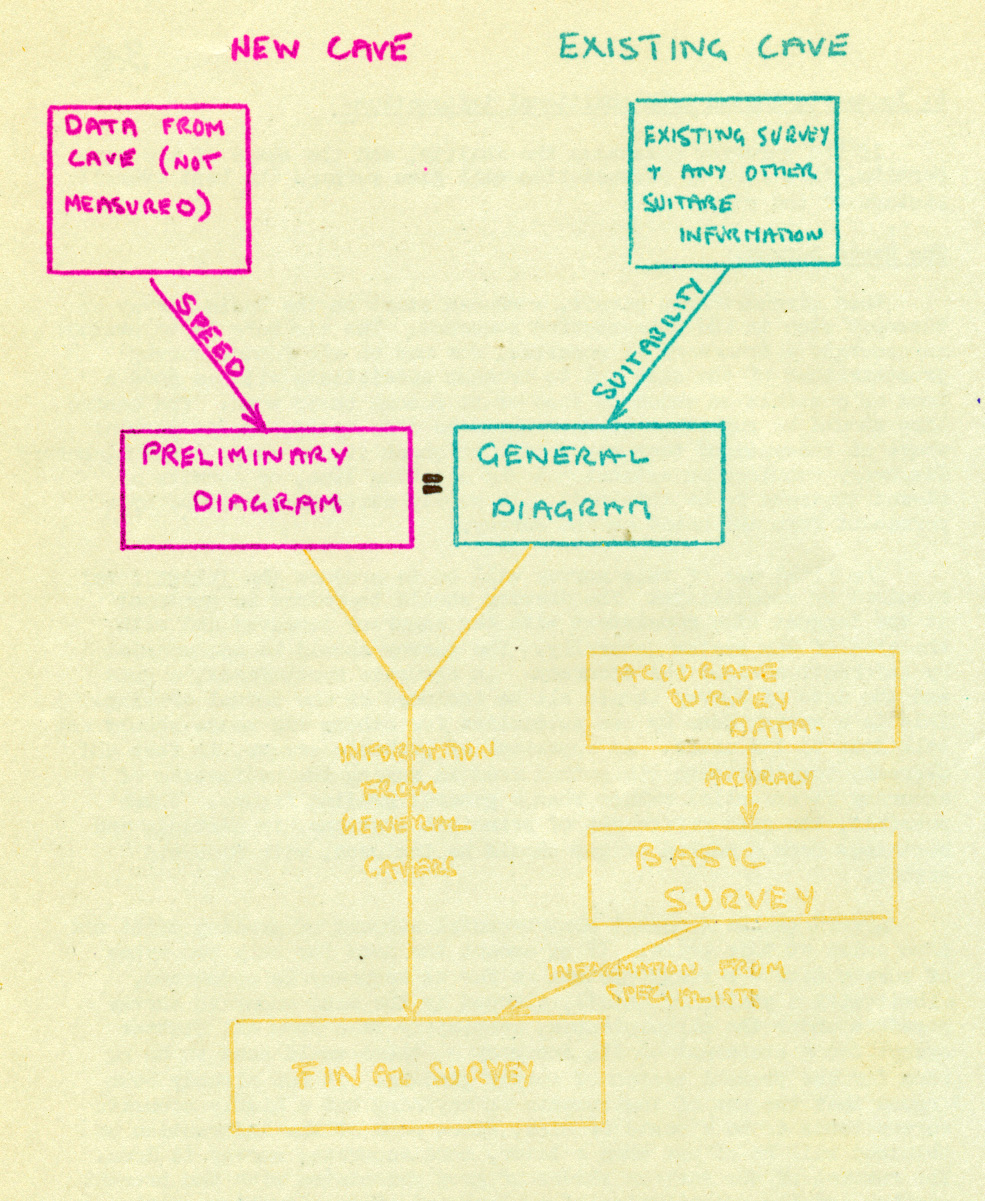
The Preliminary Diagram.
Let us suppose that a new cave system has been entered. We will see that the system to be described will work equally well in the case of an established cave, but it is perhaps simpler to take the case of the new cave system as a first step.
At the early stages of exploration, it is usually not politic to embark on a detailed and accurate survey. One reason for this is that it may still be possible that new connections between known parts of the cave system may be discovered and enable awkward parts of any survey to be tied up much better by closing what are, at present, open traverses. This objection to the starting of an accurate survey does not apply with such force to small caves or to caves which are very simple in structure. However, under the present method of working, a reasonable time usually elapses before a survey of a new cave is produced – either for the reason already given or because the cavers who will do the survey are much too busy on exploration or are generally short of available time. It is, however, at this stage of a cave’s history that the greatest number of cavers want some form of information on the new cave. An article describing the main features of the cave usually will appear in the relevant club journal within a short period after the discovery, and this may be accompanied by the odd Grade I sketch. Referring to the list of things which the average caver might well want to know about the cave which appears earlier in this paper, we find that the information normally presented within the first few weeks after initial discovery falls painfully short of these requirements.
An objection has been raised by a number of cavers to whom the original of this paper was shown which must be dealt with at this stage. The essence of their objection is that cavers prefer not to have data on a new cave as the interest in exploring a new cave is largely lost if they feel that everything has already been worked out for them and presented to them ‘on a plate’. This is a reasonable attitude – especially amongst experienced cavers, but we should again remind ourselves that we are discussing the usefulness rather then the necessity for cave surveys, and that those who have no requirement for any caving information before descending a new cave need not refer to such information.
For the remainder – and it is suspected that this will include the majority of ordinary cavers – some sort of picture should be produced as soon as possible after discovery. This preliminary information has been called THE PRELIMINARY DIAGRAM – and the aim of such a diagram should be SPEED . It’s job is to show the general caver what he is likely to be up against in “doing” the new cave, and should take any one of the following forms depending on circumstances and the nature of the cave system in question:-
-
-
- A C.R.G. Grade II survey with accompanying descriptive article.
- An annotated C.R.G. Grade II survey.
- A C.R.G. Grade II survey with additional symbolic information.
- A Severity Route Diagram with additional symbolic information.
- A Grade II survey with a superimposed Severity Route Diagram.
- An Isometric Sketch with additional information.
-
In all cases, publication within a few weeks of the initial entry should be the aim. The object of the Preliminary Diagram is to acquaint the general caver with as much information about the cave as is possible and to this end – whatever form of presentation is used – it should be packed with information – cluttered if you like – as the survey itself will not be an accurate one and need not be left free of “clutter” for the specialist.
The General Diagram.
In the case of a cave which has been discovered some time ago, and which has probably already been surveyed, it may still be useful to publish the same sort of picture for he benefit of new cavers or those from other caving areas. In such cases, the existing survey can be used as the basis of a similar type of presentation to a preliminary diagram. The term General Diagram has been suggested here, because the information is that of most use to the general caver.
In some cases, several issues of the preliminary diagram may become necessary as new discoveries are made following rapidly on the original entry. In the case of established caves, the discovery of a new series may warrant the reissue of the General Diagram or the publication of a Preliminary Diagram covering the new series only. It is thus important that all Preliminary and General Diagrams should be correctly dated and once more we must remind ourselves that the prime object is Speed.
The form taken by the Preliminary or General Diagram will depend on the nature of the cave and on the particular aptitudes of t he surveyor. Some general guiding remarks follow:-
1. Grade II survey with accompanying descriptive article.
A survey made without instruments, by sketching down the cave, should be basically capable of showing cavers the main features of the cave system concerned. Such as survey will tend to be almost useless as a tool, and obviously no measurements should be taken from it, as the survey itself was produced without measurement. On the other hand, the survey will show the routes through the cave with some idea of relative size. Its support by a descriptive article seems the best course where a number of caving techniques must be employed or where difficulties are encountered in finding the route. Possibly, one has to squeeze round a boulder through one of a number of almost identical holes in the floor of a boulder chamber. A survey might be hard put to distinguish the correct hole to the scale on which it may be drawn.
2. Annotated Grade II Survey.
A simple system may not warrant an accompanying article, but may have a few features which will not be obvious from a simple survey alone. In such cases, the writing of short explanations on the actual survey, as and where appropriate, might be a satisfactory method.
3. Grade II survey with additional symbolic information.
It may be possible to present the annotations in the form of conventional signs or symbols – on the other hand, a mixture of this and the last method might be considered most suitable in some cases.
4. Severity Route Diagram with additional symbolic information.
Where the hazards and relationship of routes are considered to be more important than the presentation of a picture of the cave, or where the form of the cave is such that a confusing survey results, it may be considered best to use the Severity Route Diagram. This by itself is probably not enough and so the addition of symbolic (or written) information will perhaps, be considered to complete the amount of information desired.
5. Grade II survey with superimposed Severity Route Diagram.
Where the type of cave permits, this method allows the information of the Severity Route Diagram to be combined with the picture of the cave in more conventional form.
6. Isometric Sketch with additional information.
If the surveyor possesses the ability, and the shape of t he cave permits, this form of presentation will give perhaps the best overall picture of the cave.
The Basic Survey.
When circumstances permit, work can start on the Basic Survey as the next step in the presentation sequence. The aim here is to produce as accurate a framework as possible, for use on all future survey presentations of the cave and to present specialists with as good a tool as possible on which to base or to record their work. The centre line should be such that it need never be done again, except perhaps where an independent team may decide to check it, or where a new discovery requires an extension to the existing line, or permit a closed traverse to be obtained. All survey stations should be of a permanent form and noted on the survey.
The first use of this survey will be to produce the ‘blank form’ required by specialists. The drawing should therefore be produced at the largest size consistent with the accuracy achieved and with the size of the system generally. The survey should be accompanied by information about the accuracy. An accurate North Point, a grid and the date of survey should all be included on the actual drawing. This is a survey done by one specialist for others and hence should not talk down to its users. An appraisal of probable errors, in feet arid degrees, together with the method used in making the estimation of accuracy is essential rather than a general grading figure. Where possible, the grid references of principal stations, in Eastings and Northings from a marked origin should be included, with probable errors.
SEQUENCE OF CAVE SURVEY PRESENTATION
A word on the somewhat controversial subject of grading might not come amiss at this point. If we accept the need for only two types of survey data – a rough picture as far as accuracy is concerned, albeit with a wealth of detail, followed by the most accurate survey possible under the circumstances, completely free from all clutter except for a statement on its accuracy – there would seem to be no room for the present system of survey grading. It has already been argued that the use of instruments on anything but a highly accurate survey tends to be a waste of time, since none of the information so obtained will be of use when a later, more accurate, survey is done. The removal of the various shades of grey associated with the present system, and the substitution of a black and white situation, with one type of survey of no real accuracy and the other type of very high and stated accuracy will, the writer hopes, lead to the eventual abandonment of the grading system.
The basic survey should be kept as ‘clean’ as possible. No information as to types of floor, depths of pitches, or any aids to caving should be incorporated.
As with the Preliminary or General Diagrams, the Basic Survey will, it is assumed, be used – in this case, by various specialists. Thus, a series of marked up versions of the Basic Survey will gradually appear which have been marked up with data obtained by specialists. One such version may have the distribution of various types of cave fauna marked upon it. Another may contain geological and/or hydrological data. Yet another may be concerned with the present or future state of further exploration of the cave system. It is hoped that contact between these specialists and the surveyor would be maintained, and that the surveyor would be sent copies of all such specialist surveys.
The Final Survey.
There would come a time when, apart from unexpected new discoveries, it could be assumed that the cave system had been fully explored and worked on by the specialists. At this stage, the production of a Final Survey should be contemplated.
The form of this document – whose aim should be completeness – must be dictated by the nature of the cave. As every caver knows, caves vary very considerably – in fact, no two caves are the same – and it therefore seems unrealistic to expect that the Final Survey of two caves such as St. Cuthbert’s and Badger Hole should be of exactly the same form. The task of the surveyor at this stage will thus be one of deciding how best to present the information at his disposal. In simple cases, it may be possible to present all the information on a single survey sheet. In others, it may be necessary to publish a series if sheets, each illustrating some aspect of the cave system.
Although the aim of a Final Survey should be that of completeness, the surveyor may, quite legitimately decide not to include all the information which he has received. As an example, it may have happened that a caver interested in underground communication may have used a copy of the Basic Survey to plot field strengths in parts of the cave with respect to a transmitter set up in the system. Such information is of very limited interest and will probably have in any case been published separately. The surveyor may decide merely to include a suitable reference to the work without actually including it.
Thus, a Final Survey will be published – varying from a single-sheet to a comprehensive collection of surveys, and the task of the surveyor completed., at least as far as normal survey documents are concerned. Even at this stage, it may still be decided to go m for one of the ‘one off types of further aid.
SECTION FIVE – An Example of Survey Presentation
Problems and Limitations.
A paper of this nature would not be even approximately complete without some form of example of the presentation system and methods discussed in earlier sections, and thus some attention must be paid to the inclusion of at least some forms of suitable examples. It is at this point that considerable problems appear. The writer is very conscious of the fact that the method he has finally chosen is by far from being completely satisfying. Perhaps it would be as well to examine the problems before describing the solutions offered in this section.
Size and Scale of Examples.
The inclusion of a number of very large sheets of paper in a report of this nature is felt to be impracticable. Perhaps one would be not too unreasonable, but the subject here demands a number if it is to be covered fully. Thus, we can assume that we will be limited by the size of paper on which this report is printed.
This being so, we now have the choice of including large areas of cave survey as our examples ( of necessity to a small scale) or small areas of cave to a larger scale. On the one hand, it will not be possible to show any detail, and on the other, the area of cave will be so small that a representative range of features will not be able to be included. The only answer to this problem is to try to effect some sort of compromise. This has been done.
Selection of Cave System.
This, if anything is an even bigger problem. After some thought had been given to this aspect, the choice appeared to narrow down to two. Either the cave used as an example should be known to almost all cavers – or it should be known to none. In the first case, the reader would be able to compare what he saw on the surveys with what he knows of the cave – although this very knowledge would prevent him from seeing just what he could learn from the survey. A cave that is known to nobody would not suffer from the last snag, but would suffer from the first.
Solution Adopted.
At first, it was planned to include a very large number of examples, of every sort of presentation suggested in this paper – to large and small scales – and of both little and well known caves. In the original version of this paper, the inclusion of a very large number of examples seemed to distract rather than aid most readers on whom it was tried out. The following has therefore been adopted.
In this Paper. An entire imaginary history of survey presentation, along the lines discussed in the last section of this report, will be presented as an example. Some portions of the survey history will be drawn on a small scale, and roughly suggested rather than be accurately detailed while others will be small fragments of larger surveys.
Elsewhere it is hoped to do a series of General Diagrams – taking the Upper Series of Swildons Hole as an example of a well known cave – and to publish these later along the lines of normal surveys.
Hawthorn Hole – Some preliminary remarks.
The use of an imaginary cave system has some advantages, as have already been mentioned. The main one of these is that the reader- is placed in the position of a caver who has never entered the cave and. cannot obtain information from other sources than the data which is presented, to him via the survey.
Hawthorn Hole was originally conceived by the writer in conjunction with a fictional story with a caving background, which was written in 1957. The cave as drawn then to illustrate the book differs in no way from the cave as used new, and thus it is not a cave system expressly designed to illustrate presentation techniques. There was a strong temptation to alter some of its features to bring out some of the things already discussed in a more forceful manner, but the writer felt that no good purpose would be served by using an example which ‘happened’ to fit too well with the arguments advanced.
Let us therefore imagine that Hawthorn Hole – a western Mendip cave situated somewhere near G.B., was entered by members of the Beacon Caving Club – an equally imaginary body – on the 12th of July, 1957. Preliminary exploration was such that, by the 25th of that month, a preliminary Diagram had been published. This diagram is shown on a very small scale below. The surveyors chose an annotated Grade II sketch for the very human reason that the size of their discovery turned them against a diagrammatic form which would not emphasise the large passages. This is a perfectly valid line to take if we remember that one of the functions of a survey drawing is to enable a mental preview to be made of the system.

Preliminary Diagram – First Edition.
The drawing below shows the type of Preliminary Diagram first produced. Comparison of this with the later Basic and Final surveys will show that very considerable inaccuracies exist in this diagram, but it nevertheless serves its purpose in giving a quick look facility to newcomers, together with a few remarks on the cave. In fact, such a diagram would contain rather more information than can be indicated on such a small scale plan. This is suggested by the “Notes on Caving” in the box on the bottom right of the drawing.
Underneath the Preliminary Diagram on the previous page, will be found a simple illustration of one of the uses of such a diagram. This is a copy which we will imaging has been marked up by cavers who arc concerned with the further exploration of the system.

Preliminary Diagram – Second Edition.
It was mentioned earlier that the problems associated with any cave are such that each cave must be taken on its merits. The general system of cave survey presentation outlined in the last section of this paper must therefore be taken as an overall guide only.
In the case of Hawthorn Hole, let us imagine that, shortly after the making up of the copy of the Preliminary Diagram illustrated under the drawing on the previous page, the sump was successfully dived. This led to the discovery of a large new series (Porter’s Series) which also connected with the hole noted 50′ up the wall of the Hall opposite Tributary Passage. A second passage on the other side of the Hall (The Ramp) was also found to connect back to the Hall – in this case in the roof at the junction of the Hall and Tributary Passage.
Within a few clays of these discoveries, arrangements were in hand to publish a new version of the Preliminary Diagram – along the same lines as the original. When Porter’s Series was discovered, the explorers did a Grade II as they went, and it was assumed that a separate Preliminary Diagram of this series would be produced. The other connection with the Hall (via the Ramp) meant that the whole of the cave would have to be presented again.
Before this could be done, a further discovery was announced. The passage at the end of Banwell’s Chimney had now been pushed and a very tight passage (Pantomime Passage) found, which led from there to the top of the Ramp. Before this information in its turn could be dealt with two more discoveries were made. The first was the forcing of the connection between Boulder Chamber and the Main Stream Passage beneath. This revealed a very large discrepancy in the original Grade II survey. The second was a minor connection from the end of the entrance boulder ruckle to the stream passage.
In view of all this activity, it was now decided to republish the preliminary diagram as a Severity Route Diagram with annotations or additional symbols. This form of presentation was decided upon for two reasons. Firstly, the cave system was by now fairly complex, and a route diagram of some sort seemed a good idea. Secondly, publication in this form would remove the need for performing a new Grade II survey of the whole cave, which could be left until an accurate survey was eventually carried out.
It is hoped that most readers will be reasonably convinced of the usefulness of Preliminary Diagrams by now. Imagine yourself in the position of a caver who was unable to revisit the cave after the first discoveries had taken place. You will be in this position if you refer to the original preliminary Diagram. Now imagine that you constantly hear talk of places like Dogleg Passage, Procrustes Passage, Birthday Chamber and the like. A new Preliminary Diagram will give such information in a convenient form.
The drawing opposite shows a small portion of this second Preliminary Diagram.
Basic Survey.
It must now be supposed that work would start on the Basic Survey. The surveyors would find that both the Preliminary Diagrams were of some use in planning this. The Second Edition could be used as a key on which to plan the various closed traverses while the first would provide them both with a rough shape of some of the actual cave and with a warning of the discrepancies which had already been found.

The drawing opposite the next page of text shows the shape of the cave plan as revealed by the basic survey, and is also intended to give an overall impression of the type of survey envisaged. As with the first Preliminary Diagram, it is reproduced on too small a scale for any detail to be shown, but gross features such as the overall gridding and the general clean appearance can be seen.
The next drawing shows an enlarged portion of this Basic Survey. Some of the survey notes are now readable, and the positions of main, permanent survey stations can now be seen. It is likely that a table of Eastings and Northings of these iterations would be incorporated somewhere; on the survey sheets.
The drawing following this again shows a copy of the basic survey as used by a geologist. Once again, the small scale prohibits anything but the merest suggestion’ of data to be shown (and in any case, the writer must apologise to any geologists for the no doubt completely fallacious data he has imagined). It should be imagined that this is one of a number of copies of the Basic Survey which have been used by specialists – some of which may have been used by them to illustrate papers, reports etc but copies of all have – we hope – been passed back to the original surveyors.


This particular copy suggests possible discrepancies in portions of the Baric Survey. By feeding such information back to the surveyor, he will be kept in the picture and be able to decide whether there is any need for resurveying.
Final Survey.
Eventually, when the surveyors have satisfied themselves that their survey information is as accurate as possible, that as much specialist information as they are reasonably likely to receive has come their way, and that the likelihood of new major discoveries now seems remote, a final survey will be published. This may, of course, by added to later if necessary, or even reissued, but the general aim is to present a complete picture of the system and so it will wait for quite some time – a number of years in the case of a system of the size of Hawthorn Hole. The final picture, facing the next page of this paper, is that of a portion of the supposed Final Survey of Hawthorn Hole. In this case, we imagine that it has been decided to include all the information on one survey drawing. As only a very small portion is shown, many of the features cannot be included at all, but we see that some symbols have been used, and we conclude from the red ‘geological’ line that specialist colouring has been adopted.
In no case, during the course of these examples has any elevation been shown, and in only one case are there any sections. This should not be taken to mean that cave plans are most important rather than elevations or sections, but that limited space and facilities in a paper of this nature have made the writer concentrate on plans only.
With this rather sketchy outline of a presentation system in action, our description of this imaginary cave, and out treatment of the whole subject comes to an end. It must be once again emphasised that none of the illustrations in this paper are of anything like the standard which one would hope to see in actual work, and the reader is asked to exercise some imagination and indulgence in this direction.
It now only remains to summarise and conclude.
Summary and Conclusions.
This paper has been written to stimulate thought and to spread the writer’s contention that the presentation of Cave Survey Data should be a much bigger and more interesting subject than present usage allows.
The time and effort spent on any survey is only justified by the subsequent use to which such a survey is put. In order to ensure that it is so used, some thought must first be given to the type of use – and hence the type of user – for which the survey has been designed.
Having decided this, then any technique of presentation which seems best fitted to achieve the object should be employed.
There will probably be more than one type of survey of the same cave as a result of this approach. The stages at which each type could best appear have also been discusser, and a framework suggested of Preliminary Diagram – Basic Survey – Final Survey. However, in all cases, this framework must be fitted to suit the cave, as was shown in the example.
In conclusion, the writer hopes that a user based approach may become more common practice, and that the success of any survey should be measure by how quickly copies wear out through constant use. In this connection, he hopes that this paper may stimulate others into perfecting and consolidating this tentative venture into what is largely new ground.
REFERENCES
(i) WHITE, W. “A Plan & Section of Pen Park Hole.” (Pen & ink drawing as the frontispiece of G.S. Catcott Ms. “Relation of the Rev. Mr. Thos. Newman’s falling into Pen Park Hole.” 17th March, 1775.) White’s notes are on pages 25 to 31.
(ii) BUTCHER, R. “Cave Survey” Cave Research Group Publication No 3. 1950.
(iii) ELLIS, B.M. et al. ” A Preliminary Survey Plan of St. Cuthbert’s Swallet.” B.E.C. Caving Report (8), Feb. 1962.
(iv) WARBURTON, D. W.C.C. Journal. No 89, Vol 7 PP 166 – 181.
(v) CRICKMAY, J.H. & BENDALL, R.A. “ASurvey of G.B. Cave – Charterhouse on Mendip” U.B.S.S. Proc.6, (2) 174/85 1949/50.
(vi) ELLIS, B.M. ed. “Mendip Survey Colloquium.” M.C.S.C. Rep. 13.8.63.
(vii) BUTCHER, A..R. “Cave Surveying, (Ch. 17 of) Cullingford, C.D.H. British Caving. 1st Edn. 1953 PP 389/415. 2nd Edn 1962 pp 509/535.
(viii) RA,ILTON, C.L. “Searching for Caves.” (Ch. 12 of) Cullingford, C.D.H. British Caving. 1st Edn. 1953. PP 312/319 2nd Edn. 1962 pp 424/430.
(ix) CR0OK, B. & PEARCE, R.
(x) COASE, D.A. Belfry Bulletin 121 pp 1/2 Feb 1958.
(xi) COLLINS, S.J. ” Topological Diagram of St. Cuthbert’s Swallet.” Ms. 1961. and Belfry Bulletin 133 Feb 1959.
(xii) ELLIS, B.M. “Adiagrammatic Route Plan of St. Cuthbert’s Swallet.” B.E.C. Caving Rep (7) Frontispiece (Feb 1962)
(xiii) IRWIN, D. Report on St. Cuthbert’s Swallet.
ILLUSTRATIONS
All the illustrations were originally numbered and were set out in the same way as the main text (i.e. always on the right hand side of the open book as it is read). It was felt better to alter this, so that in most cases, the illustration could be referred to at the same time as the appropriate piece of text is read. Thus the illustrations are no longer numbered, and are all printed so that they appear on the left hand side of the open book as it is being read.
All the illustrations (with one exception) are referred to in the text, which also explains where they are to be found and the order in which they should be considered as the text is read. Thus the text provides a series of instructions on looking at the illustrations, which it is suggested the reader follows.
Apologies are made for the poor standard of reproduction of some of the illustrations and readers are also warned that the dies used in the Banda process which has been used in order to allow different colours to be used are sensitive to light.
The book should thus not be left open at one of the illustrations in strong sunlight.
The above does not apply to this version as it has been printed on both sides of the page in order to conserve paper, but it still applies to the illustrations where appropriate.